URBAN AIR POLLUTION MANAGEMENT


Air pollution is both an environmental and a social problem, as it leads to a multitude of adverse effects on human health, ecosystems and the climate. Air pollution is one of the largest environmental health risks in world today. Quality of the air in city and urban areas is the most important factor that directly influences the incidence of diseases and decreases the quality of life.
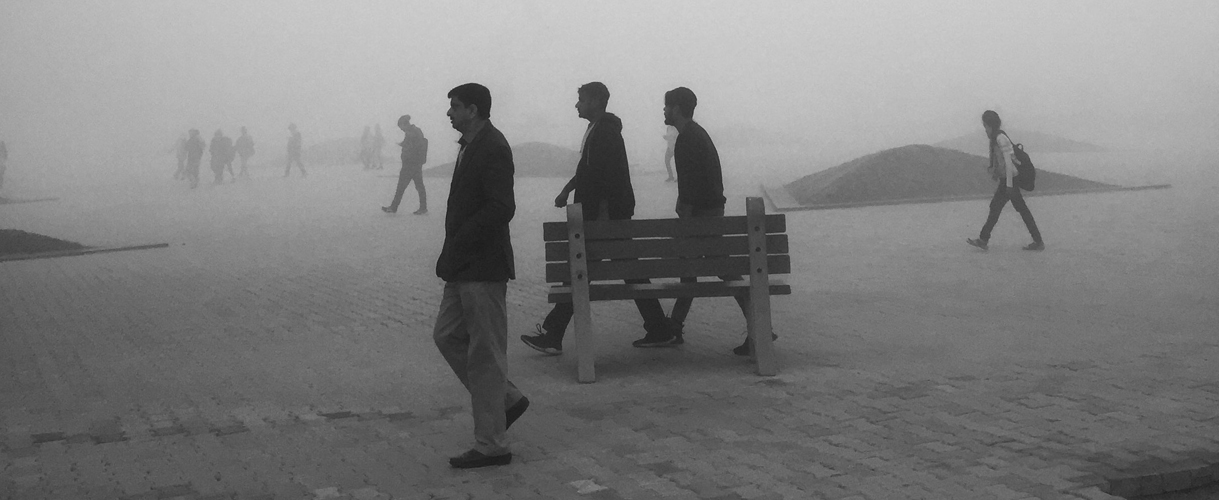
Urban air pollution is a complex mix of gases and particulate matter that negatively affect communities living in and around urban areas.
It is most recognizable by that thick brown haze (an atmospheric phenomenon in which dust, smoke, and other dry particulates obscure the clarity of the sky) which blankets cities across the world, especially in summer, known as photochemical smog (a type of smog produced when ultraviolet light from the sun reacts with nitrogen oxides in the atmosphere. It is visible as a brown haze, and is most prominent during the morning and afternoon, especially in densely populated, warm cities.)
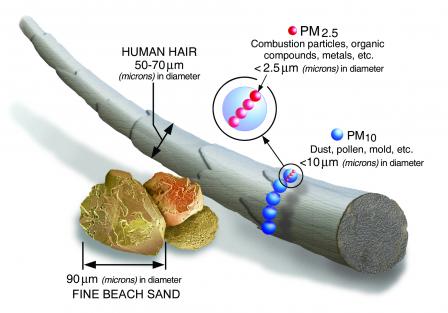
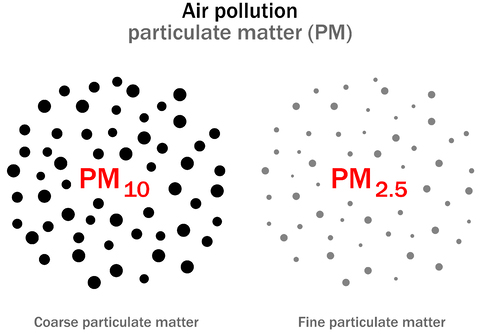
PM stands for particulate matter (also called particle pollution): the term for a mixture of solid particles and liquid droplets found in the air. Some particles, such as dust, dirt, soot, or smoke, are large or dark enough to be seen with the naked eye. Others are so small they can only be detected using an electron microscope.
Nitrogen dioxide, Ground-level Ozone and Particulate Matter are the three main air pollutants in modern cities and the health effects of these are well-documented. These three, as well as carbon monoxide and sulfur dioxide, are known as criteria pollutants.
![]()
![]()
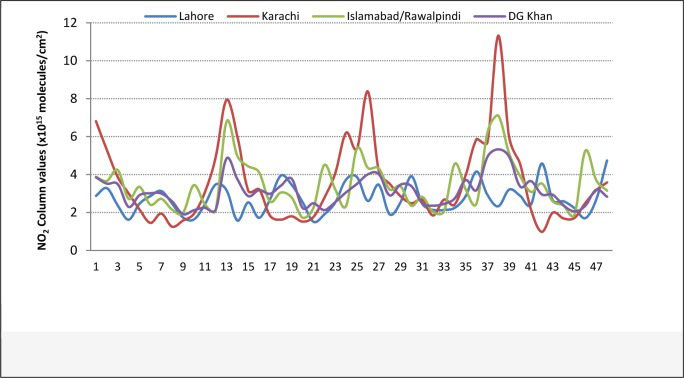
Inhalation of nitrogen dioxide (NO2) can impair lung function and increase susceptibility to infection, particularly in children. It can also aggravate asthma. NO2 is not only a toxic gas but it is also a precursor to several harmful secondary air pollutants such as Ozone and Particulate Matter. It also plays a role in the formation of acid rain and photochemical smog.
What level of NO2 is safe for life
Nitrous oxide (N2O) is a greenhouse gas (they trap heat in the atmosphere and warm the planet) with significant nonnatural sources (due to human activities like combustion sources).
Road traffic is the principal outdoor source of nitrogen dioxide. The most important indoor sources include tobacco smoke and gas, wood, oil, kerosene and coal-burning appliances such as stoves, ovens, space and water heaters and fireplaces or poorly maintained appliances.
According to the Occupational Safety and Health Administration (OSHA)2, the permissible exposure limit for NO2 in homes and offices should not exceed 5 ppm (9 mg/m3). However, NO2 levels as low as 0.1 ppm have been shown to cause respiratory discomfort in vulnerable populations such as asthmatics.
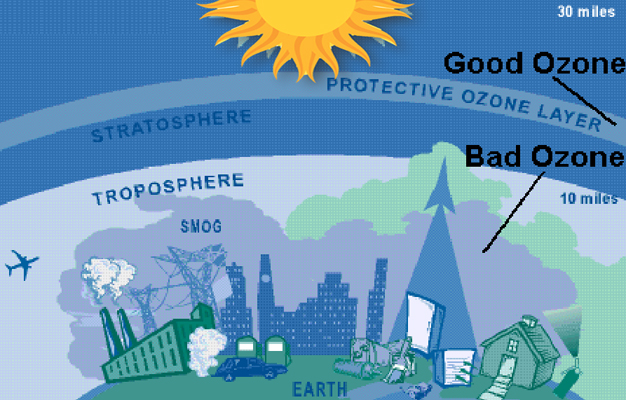
In the upper atmosphere 'good' ozone (O3) protects life on Earth from the sun's ultraviolet rays. Ozone at ground level is a harmful pollutant that is a significant health risk, especially for people with asthma. It also damages crops, trees and other vegetation and is a main component of smog. In the Earth's lower atmosphere( troposphere ) near ground level, ozone is formed when pollutants emitted by cars, power plants, industrial boilers, refineries, chemical plants, and other sources react chemically in the presence of sunlight.
In 2013, the World Health Organisation (WHO) classified particulate matter (PM) as carcinogenic to humans, responsible for the deaths of 3.7 million people worldwide per year. PM10 (particles = 10 microns) is a criteria pollutant and is a serious health risk because PM10 particles can penetrate the lungs. PM2.5 (particles = 2.5 microns) is also a criteria pollutant which has even greater health impact due to risk of penetration deeper into the respiratory system. Research has linked particulate pollution to lung and heart disease, strokes, cancer, and reproductive harm.
Carbon monoxide (CO) is a toxic, odorless gas. If inhaled it will displace oxygen from the hemoglobin molecule in our blood and lead to severe disability or even death. Sulfur dioxide (SO2) is a toxic gas with a strong irritating smell. Inhaling sulfur dioxide has been associated with respiratory disease and difficulty breathing. It is also a precursor to acid rain and atmospheric particulates.
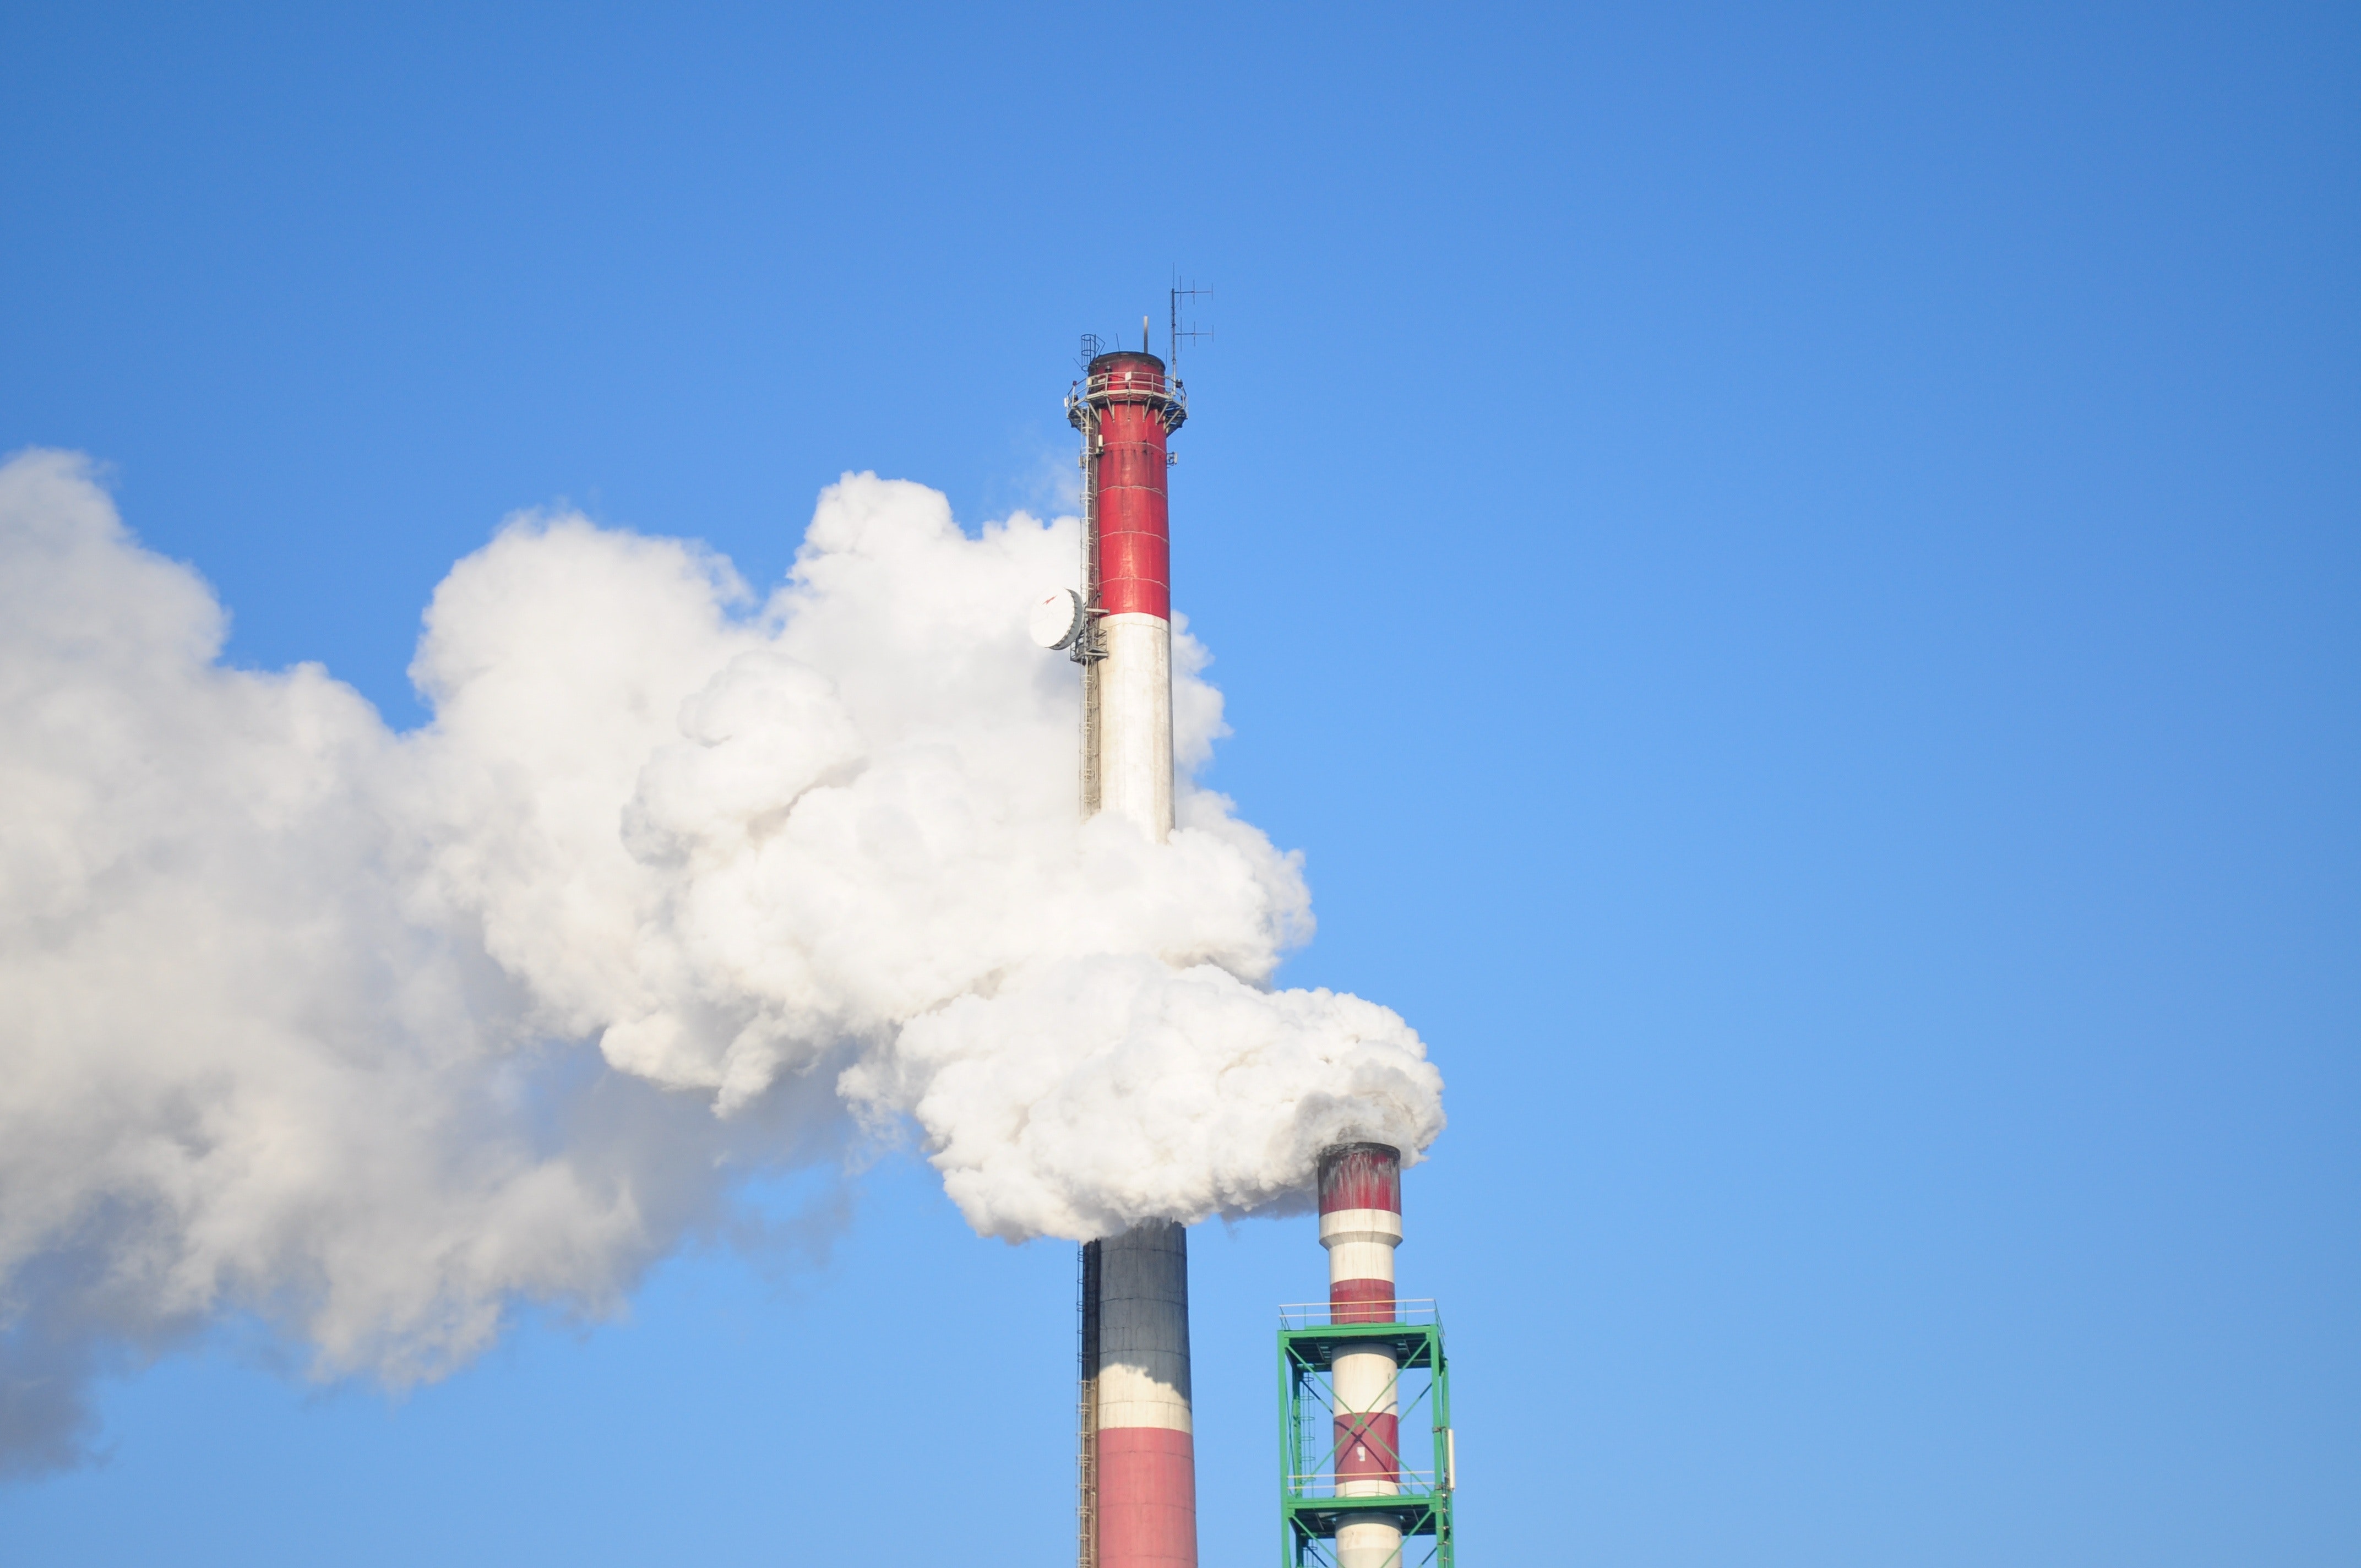
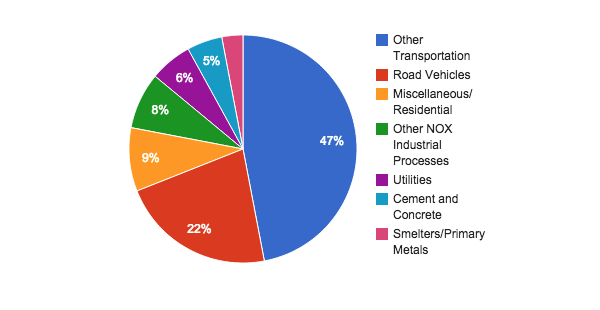
The major source of nitrogen dioxide (NO2) in urban environments is the burning of fossil fuels. In urban areas this is most commonly associated with motor vehicle exhaust. Areas with high density road networks close to large populations such as in towns and cities are most at risk of over exposure. Industrial sites will also produce high concentrations of NO2. These include any industry that use combustion processes such as power plants, electric utilities and industrial boilers.
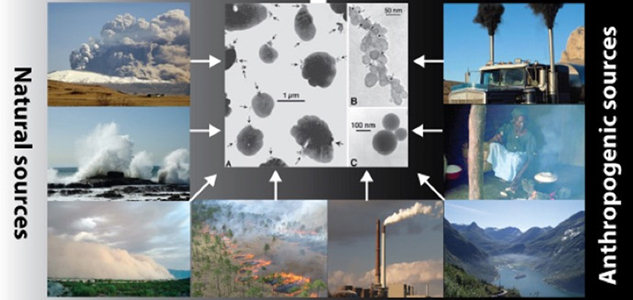
Airborne particulate matter (PM) is categorized into different size fractions. Total Suspended Particulate (TSP) includes all particle sizes and is a good measure of nuisance dust. The key sources of PM10 and PM2.5 are from human activities - vehicle emissions, burning fuels like diesel and coal, and industrial activities.
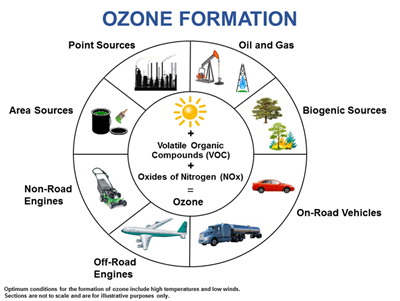
Ozone is not emitted directly, rather it is typically formed through complicated photochemical reactions, involving nitrogen oxides (NOx) and volatile organic compounds (VOC), both typically emitted from vehicles and industrial sources. As temperature increases on say a hot summer's afternoon, the efficiency of this reaction increases, and more ozone is formed.
Large urban areas often have the perfect combination of emissions and warm temperatures allowing the photochemical reaction to create the brown 'smog' blanket which is a feature of many large cities worldwide. Ozone concentrations are generally highest in cities and urban areas, but areas downwind of cities and industrial facilities can also be affected.
The main source of outdoor CO is combustion processes from transportation and industrial activity. Fossil fuel combustion at power plants is the largest emission source of SO2 into the atmosphere.
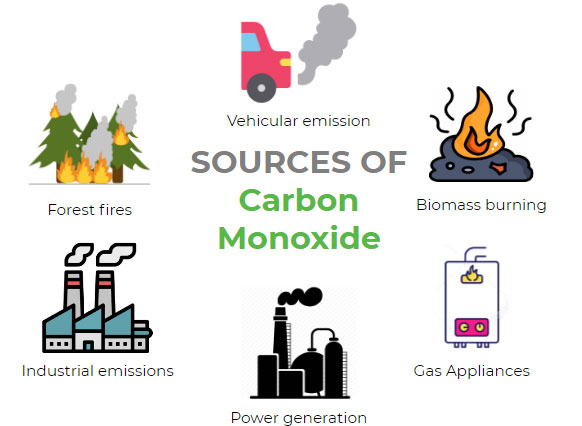
Other sources include extracting metal from ore and the burning of high sulfur containing fuels by ships, trains and machinery. However, in recent years SO2 as an urban air pollutant has been declining due to the desulfurization of fuel.
Adverse health effects have been reported as associated with both contaminants (coronary heart disease with carbon monoxide and respiratory morbidity with sulphur dioxide).
Air pollution is traditionally monitored by reference stations which take very accurate measurements and are used to build a long term understanding of air quality and to show whether or not cities are in compliance with national air quality standards. Because of their size and cost most cities can only afford limited numbers - Los Angeles, for example, has approximately 40 stations for a population of 18 million people. This results in a lack of spatial resolution in the air quality data, which carries the risk that some people are being exposed to much higher levels of pollution than the official statistics suggest. Other limiting factors of traditional monitoring stations include:
- Siting difficulties (finding an ideal location relative to the pollutant source)
- Urban expansion can change the suitability of a monitoring site
- Mobility in response to short term events or long term changes
- Cost of maintenance
- Cost of permitting and land purchase
- Cost of power consumption
- Useful measurement frequencies of 30 or 60 minutes
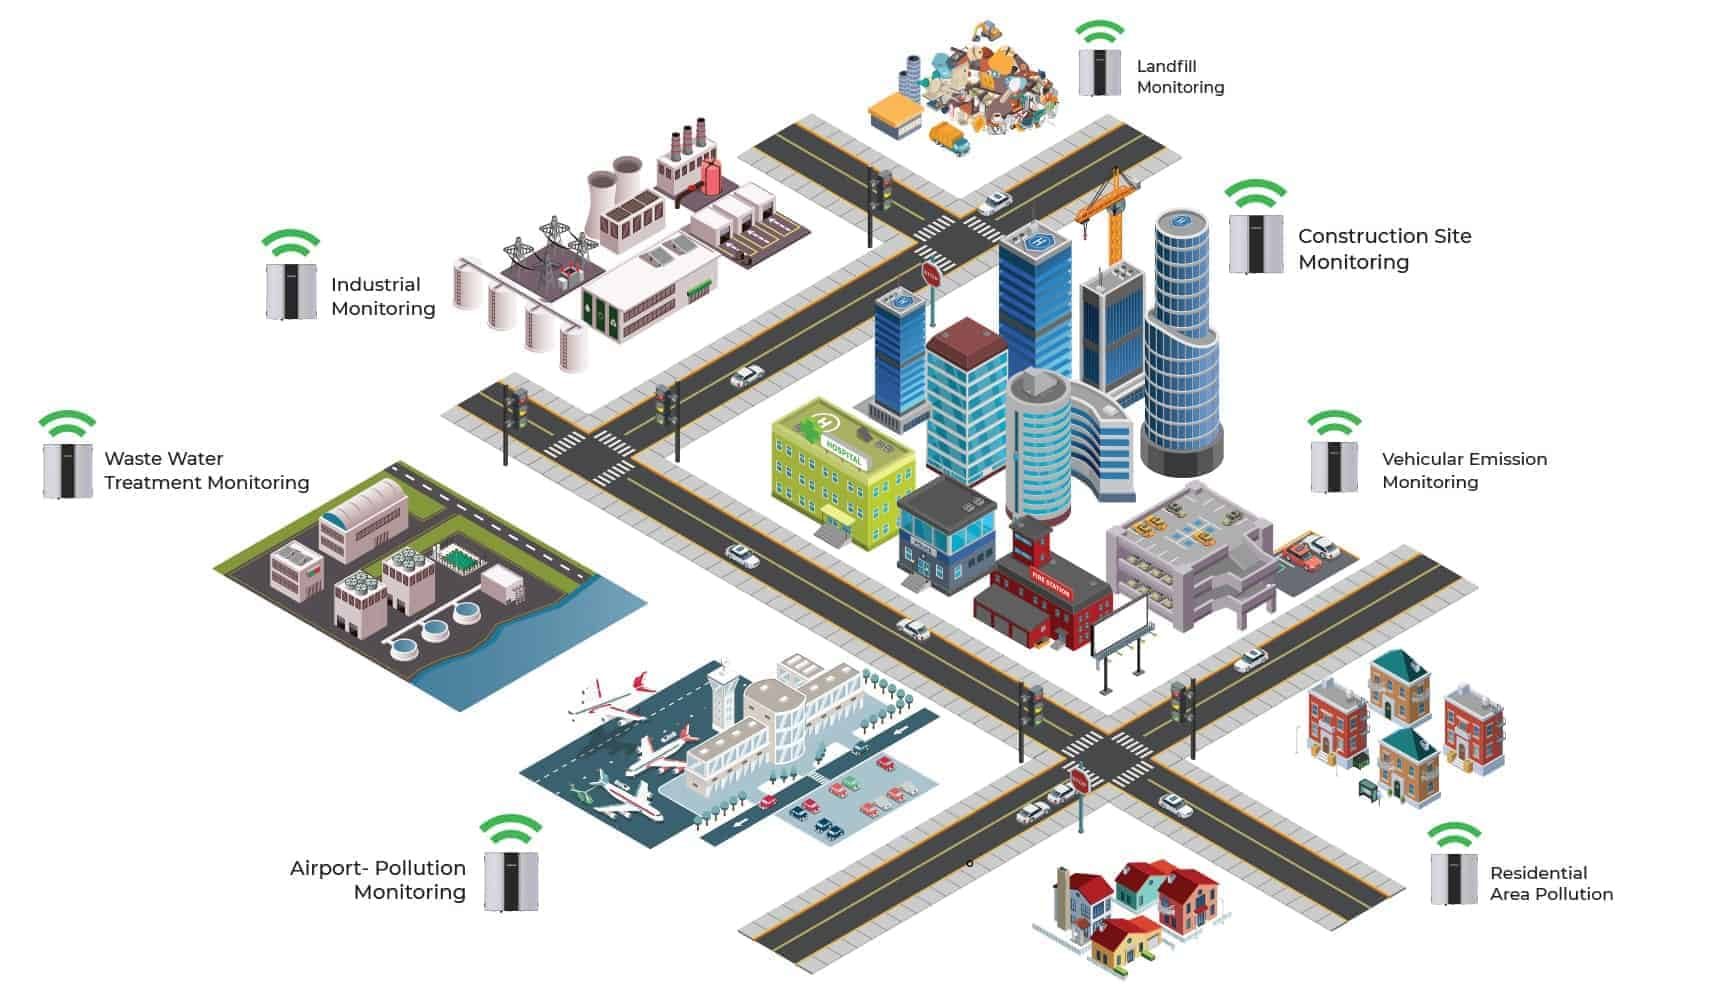
Smart cities are urban spaces that provide a decent quality of life to their citizens by offering a clean and sustainable environment. For a Smart city, it is necessary to monitor the environmental conditions for identifying the sources of pollution and mitigate them. A network of low-cost air quality monitoring sensor nodes can be deployed to monitor air quality and meteorological parameters across the city. Through pollution source detection, the city can take corrective measures and improve its environmental health. By installing disaster detection systems like floods and rainfall monitoring solutions, the citizens can be alerted beforehand in case of a catastrophic event. A holistic view can be derived, which enables the authorities to make data-driven decisions for infrastructure and policy planning.

Dust(PM2.5,PM10)

Noise

Gases(SOx,NOx,CO,O3)

Light/UV

Rain

Temperature, Humidity, Pressure

Snowfall

Hail

Visibility
Our state of the art technology to measure most parameters will be Cameras. These Cameras could be installed along with Punjab Safe City Authority Cameras, and other sensor equipment.

WeatherCAM combines cutting edge computer vision with a clever use of camera sensors, disrupting the current panorama of weather monitoring by turning non dedicated, existing cameras into the weather stations of the IoT era.
WeatherCAM enables cameras to track:
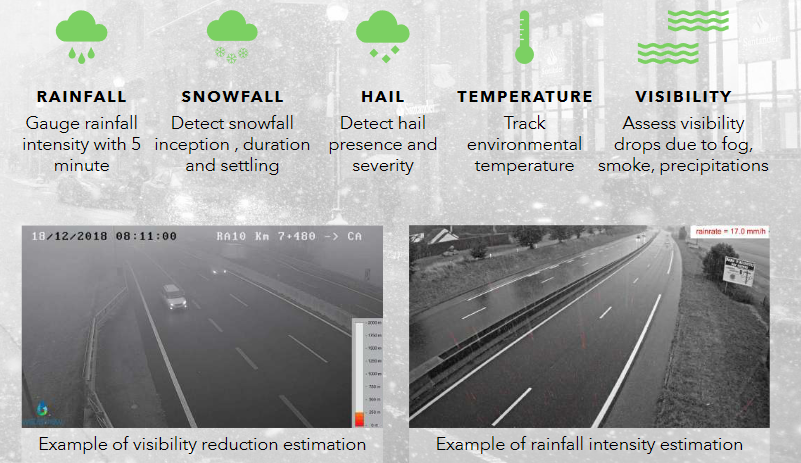
WeatherCAM pre-processes the images and computes raw weather data on both the cameras or a local server, while a backend module, that stores and combines data into useful outputs like live weather maps, weather notifications, etc.
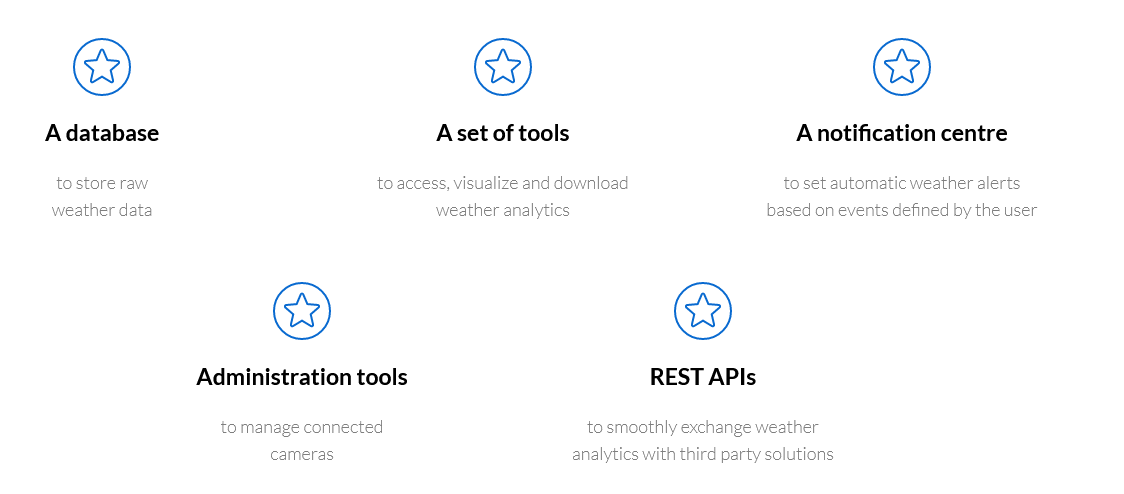
Actionable weather insights for many businesses, like public road and railway administrations or power transmission operators, and includes:
- a database to store raw weather data
- tools to visualize and download weather data and analytics
- a notification centre to set automatic and multichannel weather alerts, based on threshold events defined by the user
- a collection of REST APIs to smoothly integrate weather analytics into user's workflows and/or third party solutions.
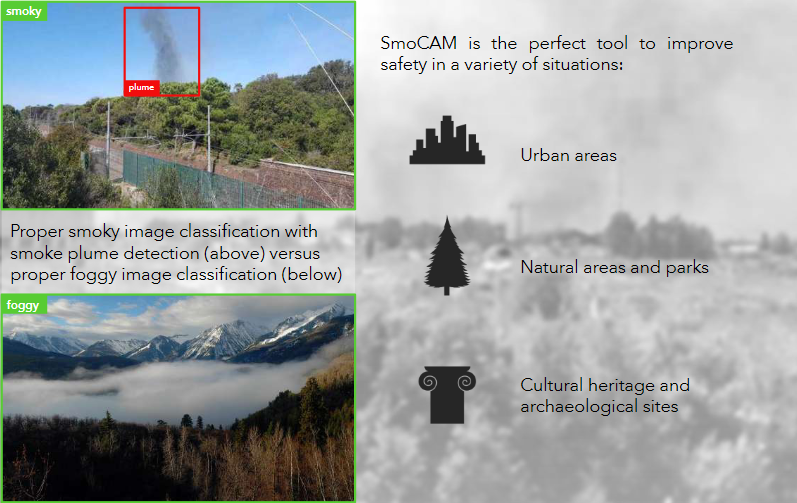
Early warnings are crucial to limit wildfires and their damages to people, natural heritage and properties. WaterView introduces SmoCAM, a video analytics solution that works in the visible spectrum and exploits common surveillance cameras to early detect smoke plumes in outdoor, thus reinforcing prevention activities even when thermal cameras fail.
SmoCAM can be used with any IP surveillance camera with a Full HD minimum resolution, and performs server side analytics that can be easily interfaced with third party solutions like Video Management Systems, Intelligent Transport Systems or Decision Support Systems.
SmoCAM is based on cutting edge computer vision techniques and machine learning technologies, to ensure detection accuracy in a variety of scenarios.
SmoCAM properly detects smoke plumes in both natural and urban contexts, no matter if the images are shot at ground level or are aerial ones, and correctly distinguishes smoky from foggy pictures.
SmoCAM outputs are multichannel notifications that contain information about the name and position of the camera that has detected the smoke plume, as well as an estimation of the distance of the plume from the camera.
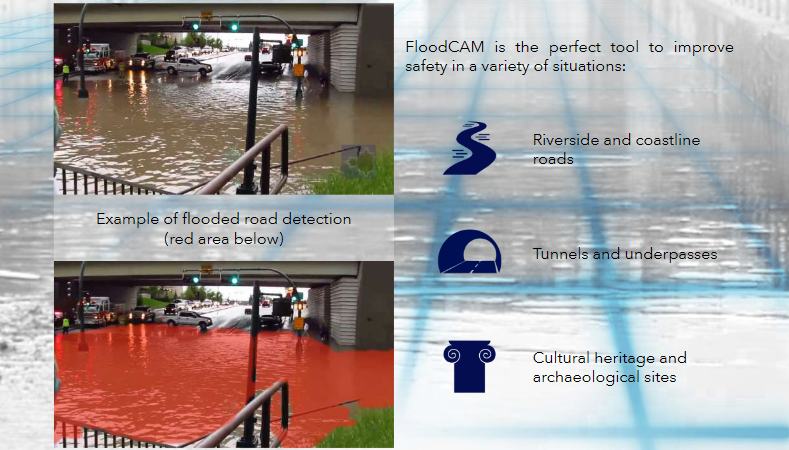
The prompt detection of water ponds and flooded areas on road pavement is critical to secure people and infrastructure safety.
WaterView introduces FloodCAM, a video analytics solution for using surveillance cameras to detect hazardous accumulation of water on the road in real time, no matter if flooding is due to the effects of local heavy rainfall or river overflowing.
FloodCAM can be used with any IP surveillance camera with a Full HD minimum resolution, and performs server side analytics that can be easily interfaced with third party solutions like Video Management Systems, Intelligent Transport Systems or Decision Support Systems.
FloodCAM is powered by state of the art computer vision and machine learning technologies, that has been optimized to process large amounts of images in short time.
FloodCAM is able to detect flooded areas in both urban and suburban contexts, and returns valuable alerts with straight, curved and mixed roads.
FloodCAM outputs are multichannel notifications that contain information about the name and position of the flooded road, as well as the percentage of the road branch submerged by water.
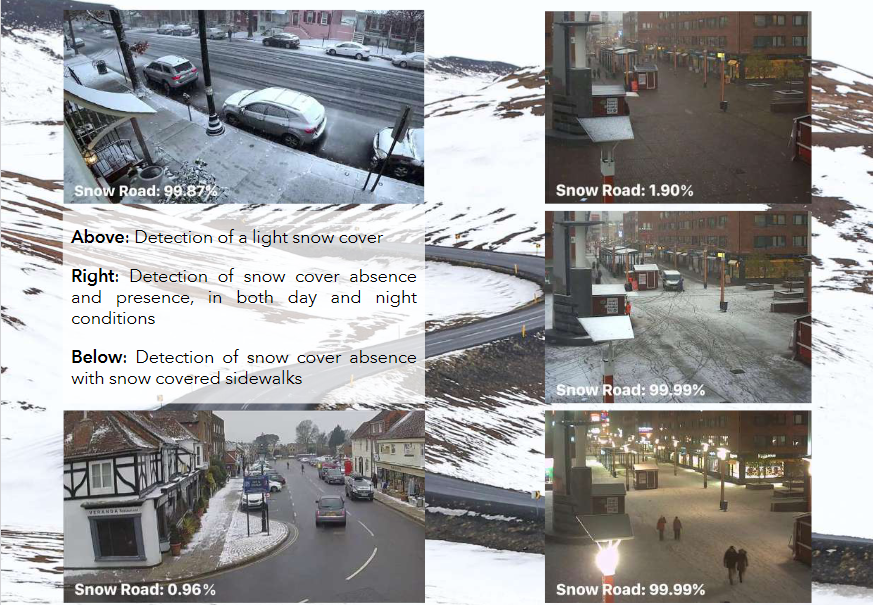
WaterView introduces SnowCAM, a video analytics solution for using cameras to promptly detect snow cover on the road pavement in real time.
SnowCAM is powered by state of the art computer vision and machine learning technologies, that has been optimized to process large amounts of images in short time even in embedded environments, from both fixed and mobile cameras (like those on vehicles or drones).
SnowCAM is able to detect snow covered areas in both urban and suburban contexts,in day or night time, and returns valuable alerts of snow presence with straight, curved and mixed roads.
SnowCAM can be used with any camera with a Full HD minimum resolution, and its outputs can be easily interfaced with third party solutions like Video Management Systems, Intelligent Transport Systems or Advanced Driver Assistance Systems.
SnowCAM outputs are multichannel notifications that contain information like the presence of snow on the ground, the percentage of the road covered by snow and, depending on the type of source camera, the name and position of the road.
Our ambient air quality monitoring system with integrated sensors and software to measure concentrations of ambient pollutants in an urban environment like PM2.5, PM10, CO, NOx, SOx, & O3. Environmental sensors monitor meteorological parameters like noise, temperature, humidity, ambient pressure, rainfall, and floods. It transmits real-time data through a wireless communication protocol to a cloud platform. The equipment is fully solar-powered with a long battery backup compatible with harsh ambient conditions. The data from our device is accessible on our Air monitoring software, which visualizes and analyzes the data in the desired formats like reports, alerts, heatmaps, trend analysis, etc
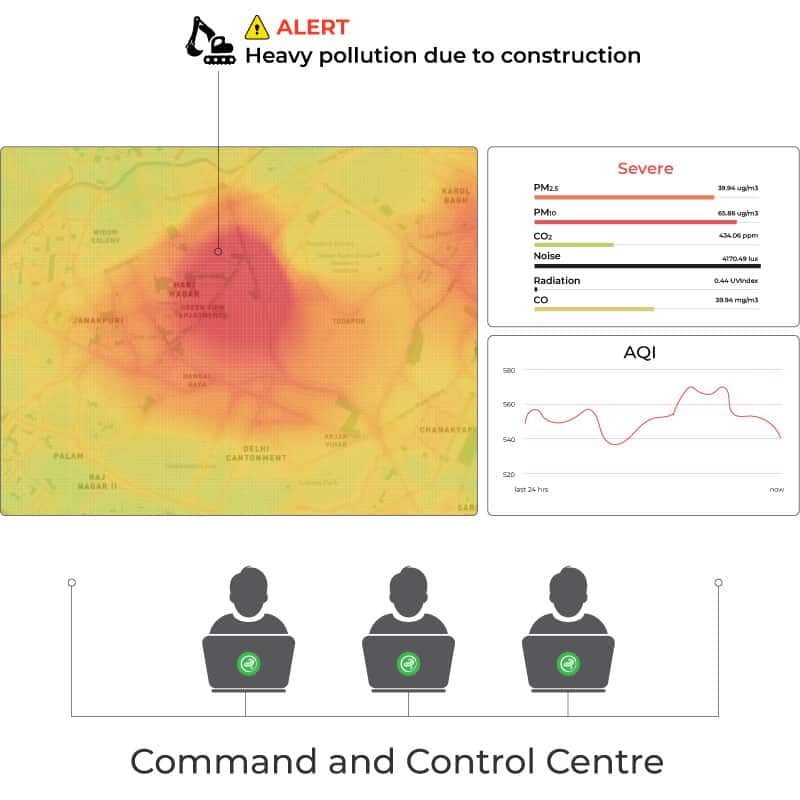
CAM modules are programmed to easily integrate weather insights in control rooms' workflows, which includes: